Maven Marketing Challenge
About the data
The dashboard was made using the data made available by the Maven Analytics company through the following website: Click here.
The dataset contains data of the marketing campaigns on 2.240 clients and have information about the customer profile, their product preferences, performance of sales channels and success of the different marketing campaigns.
Cleaning
With the data available, each feature of the dataset was analysed looking for outliers, data inconsistencies and mistakes. In order to achive this the following graphs were made:
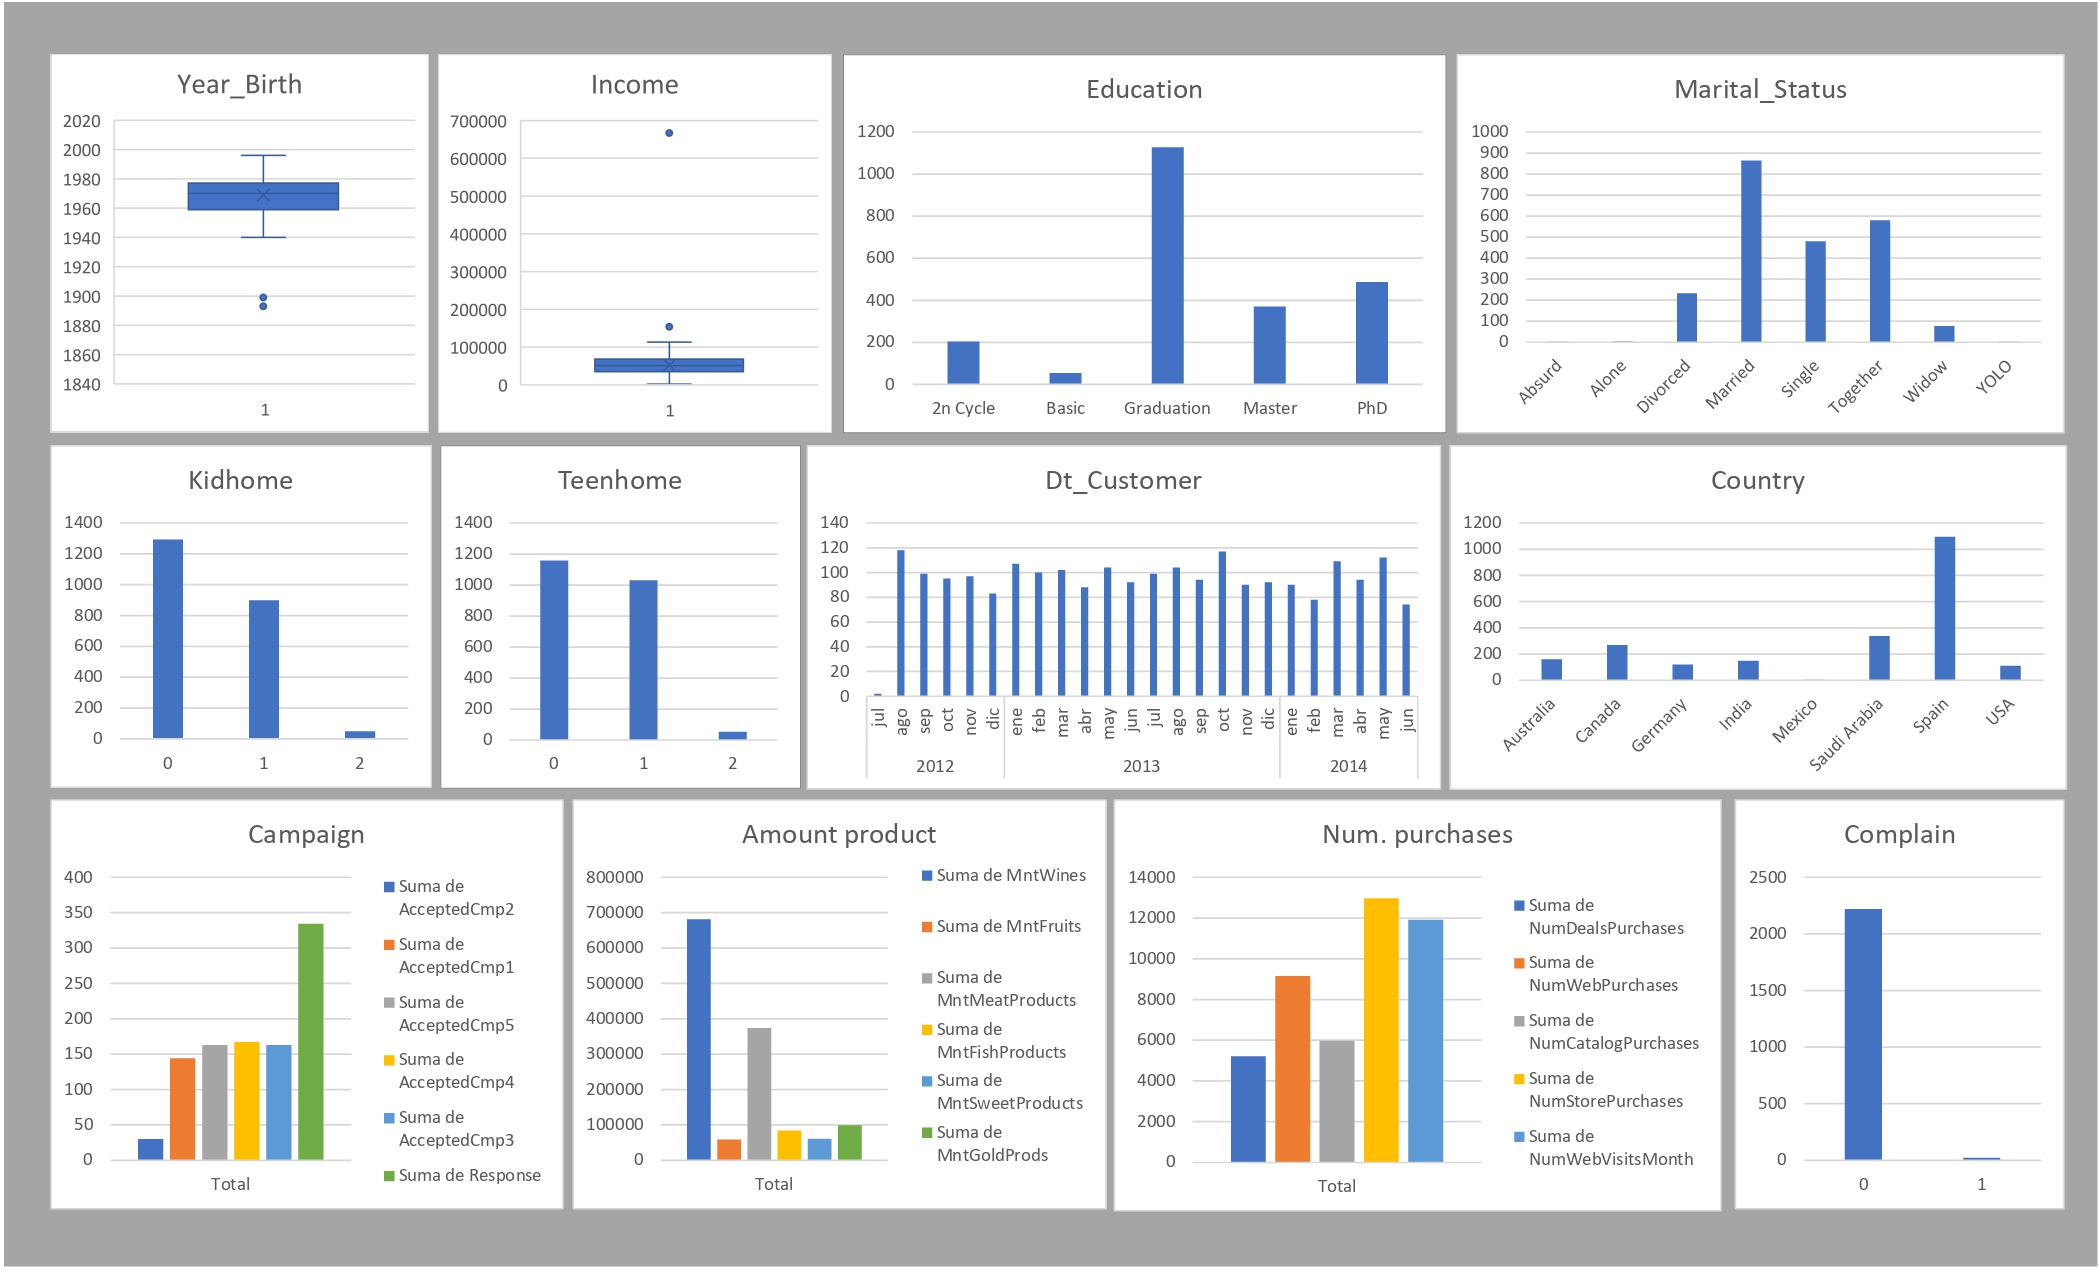
As a result of the analysis, the following actions were carried out:
Year_Birth: three customers whose year of birth is less than 1940 were eliminated.
Income: The furthest outlier value was modified by the next maximum value. The gaps were filled with the average value of the column.
Marital_status: Absurd, YOLO and Alone were changed by Single.
Finally, dynamic tables and formulas were made to achieve the dashboard.